Is your AI solution transparent, interpretable, and trustworthy enough?

From healthcare to finance, AI is making high-stakes decisions that impact lives. But how do we ensure these decisions are fair and justifiable? That’s where model explanation comes in. It enables us to:
-
Build trust by showing stakeholders why a model made a particular decision.
-
Identify biases lurking in the data or the model.
-
Improve performance by understanding the driving factors behind predictions.
Model explanation is crucial for machine learning (ML) and artificial intelligence (AI) for several reasons, especially in ensuring the responsible and effective application of these technologies.

Here are the key reasons:
-
Transparency and Trust. A transparent model fosters trust among users and stakeholders.
-
Debugging and Improvement. Understanding why a model makes certain predictions helps identify flaws or biases in the model or data.
-
Regulatory Compliance. Many industries, such as healthcare, have regulations requiring explainability for decisions made by AI systems. The European Union’s GDPR includes a “right to explanation,” ensuring users can understand automated decisions affecting them.
-
Ethical and Fair Decision-Making. Explanations help identify and mitigate biases that could lead to unethical outcomes.
-
User Empowerment. Explanations allow users to make informed decisions about interacting with AI systems. In a recommendation system, users are more likely to trust and follow suggestions if they understand why those suggestions were made.
-
Error Analysis and Risk Management. Explainability helps identify areas where the model is unreliable, reducing the risk of critical errors. In healthcare, if an AI model misclassifies a disease, the explanation can reveal whether the error stems from insufficient training data or a misinterpreted feature.
-
Adoption in High-Stakes Applications. In domains like healthcare, finance, and law enforcement, people demand high levels of accountability for decisions. An explainable AI system for diagnosing diseases is more likely to be adopted by physicians and patients.
-
Interdisciplinary Collaboration. Explanations make it easier for non-technical stakeholders to understand and provide feedback on AI models. Business leaders can collaborate effectively with data scientists if they understand why a model predicts specific outcomes.
-
Building Robust Models. Explainability can reveal overfitting, data leakage, or reliance on irrelevant features. If a model uses background noise in images to make predictions, explanations can expose this flaw.
In summary, model explanation is not just a “nice-to-have” but a fundamental requirement for building AI systems that are ethical, reliable, and impactful. It bridges the gap between complex algorithms and human understanding, ensuring these systems can be trusted and used effectively.
SHAP golden standard
SHAP is one of the most powerful tools for explaining machine learning models. It’s based on game theory and provides a unified framework to attribute predictions to individual features.
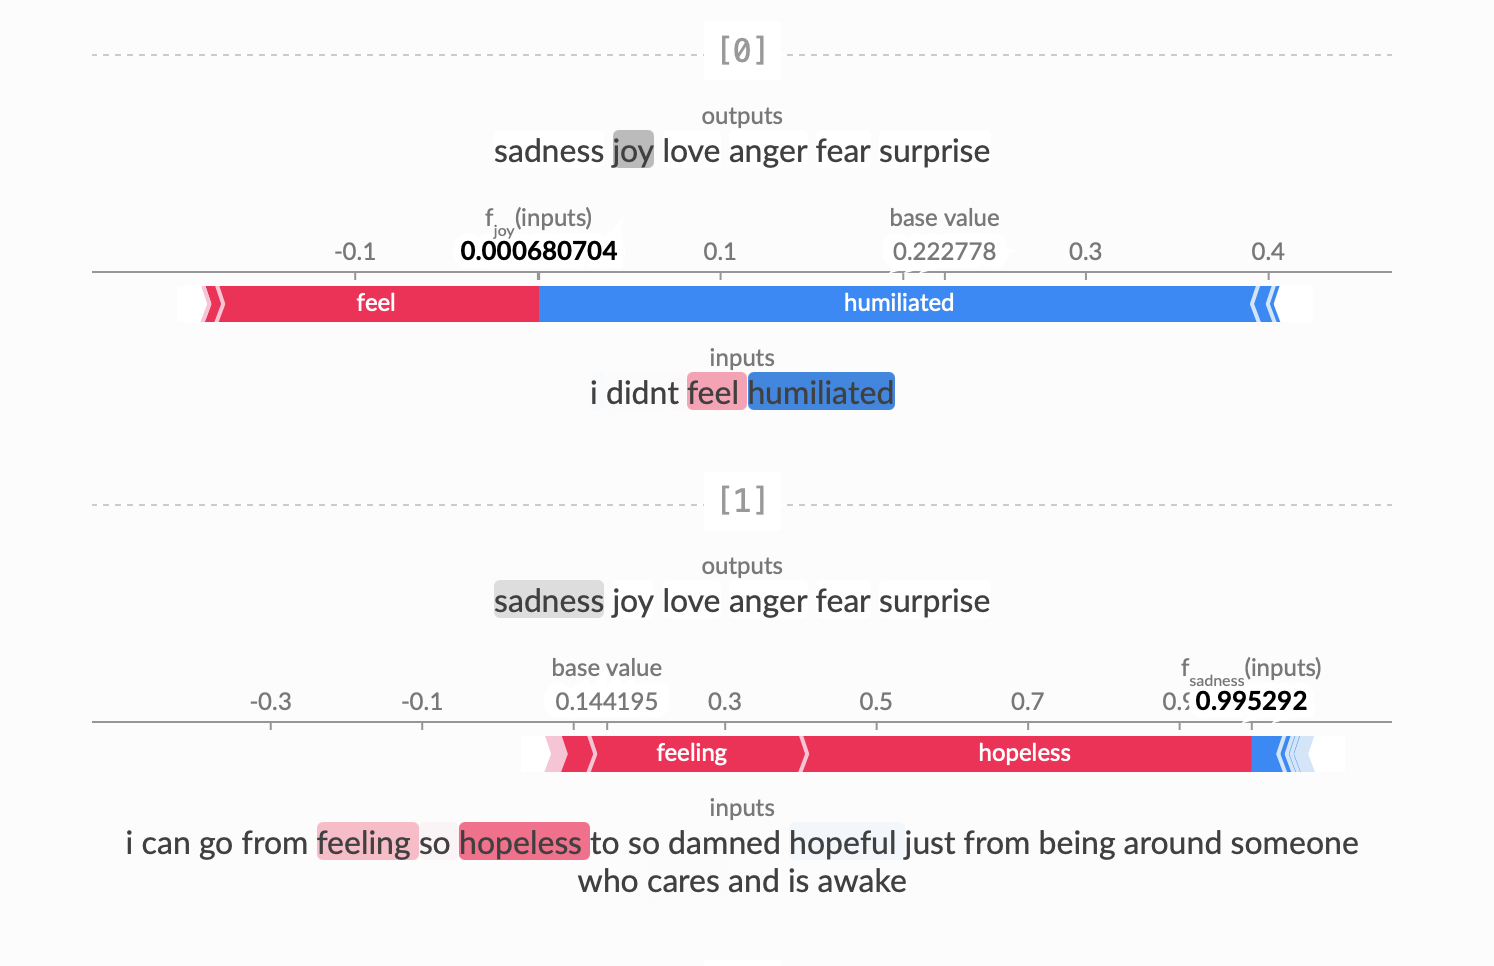
The base value is what the model outputs when the entire input text is masked, while is the output of the model for the full original input. The SHAP values explain in an addive way how the impact of unmasking each word changes the model output from the base value (where the entire input is masked) to the final prediction value.
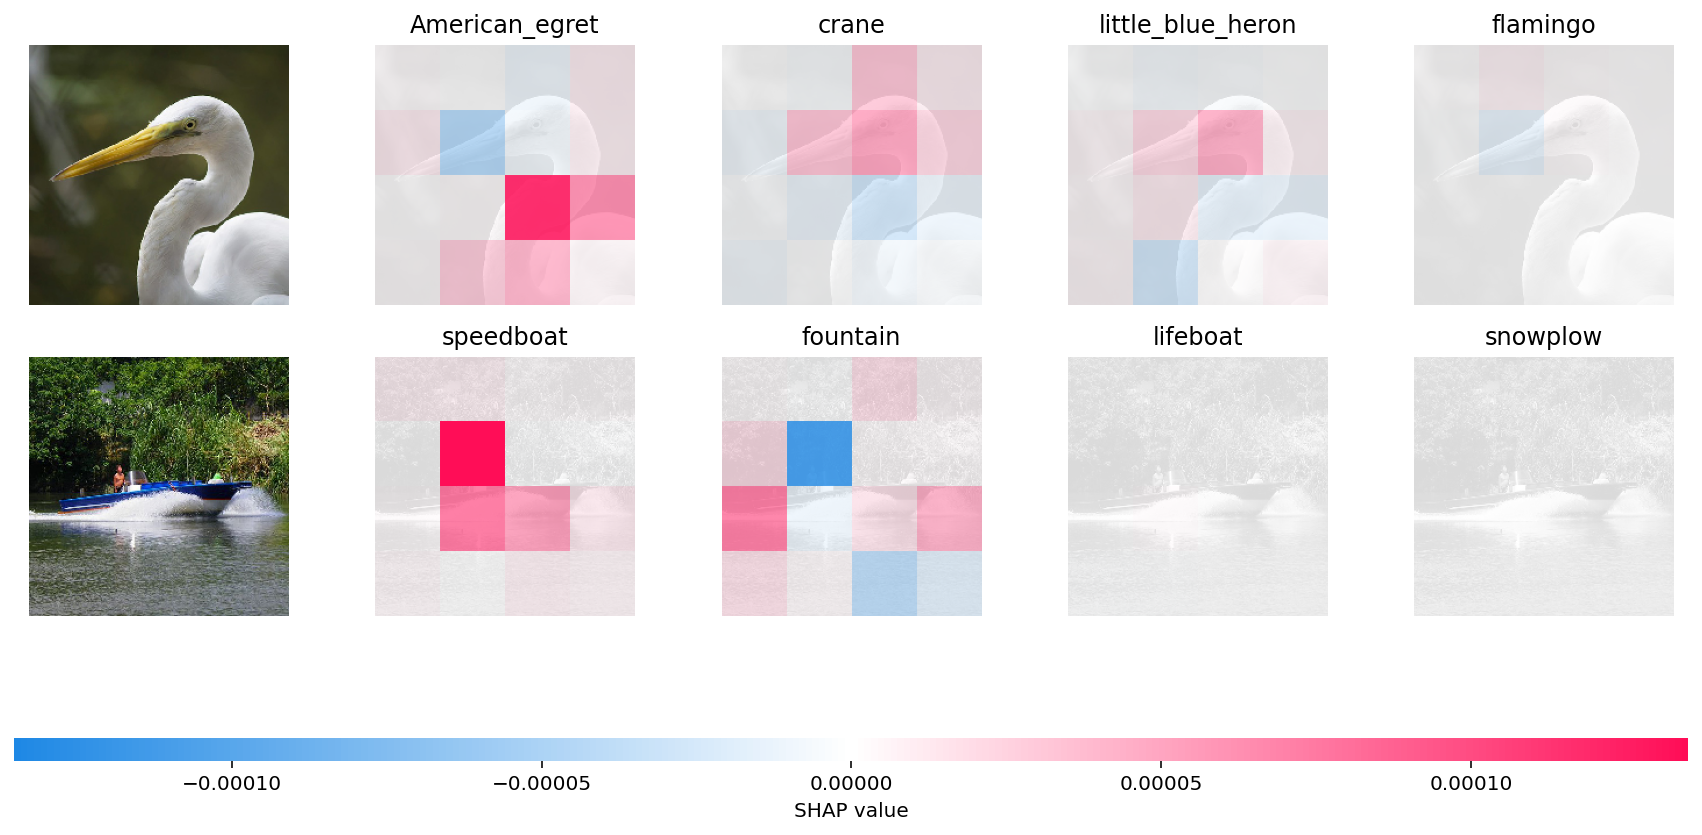
- In the first example, given bird image is classified as an American Egret with next probable classes being a Crane, Heron and Flamingo. It is the “bump” over the bird’s neck that causes it to be classified as an American Egret vs a Crane, Heron or a Flamingo. You can see the neck region of the bird appropriately highlighted in red super pixels.
- In the second example, it is the shape of the boat which causes it to be classified as a speedboat instead of a fountain, lifeboat or snowplow (appropriately highlighted in red super pixels).
The Importance of Feature Selection in Model Training
One common challenge in model development is filtering and selecting the right features. Feature selection is a crucial step in training, as it ensures the model focuses on attributes that genuinely contribute to predictions. Including unnecessary features, such as collinear, computed, or meta features, can waste computational resources and compromise model performance.
To avoid this, it’s essential to carefully evaluate and select features before training begins. This step not only saves time but also enhances the model’s accuracy and efficiency, especially for processes that might take hours or days. By prioritizing relevant features, you set a strong foundation for effective and efficient AI solutions.

In the past, feature importance analysis was straightforward when using XGBoost (eXtreme Gradient Boosting), as the framework provided built-in tools for this purpose. However, with the shift to PyTorch models containing billions of parameters, this task has become significantly more challenging.
To address this, I use the SHAP framework, which is now considered the gold standard for feature attribution. While SHAP is limited to handling simple inputs and does not directly support complex architectures like LSTMs or multi-channel convolutions, this limitation can be overcome with a simple model wrapper.
After approximately 30 minutes of SHAP computation on real-world data, you gain a clear understanding of which features to retain in your model.
# Wrap your PyTorch model to use with SHAP
class WrappedModel:
    def __init__(self, model):
        self.model = model
        self.model.eval()  # Ensure the model is in evaluation mode

    def __call__(self, x):
        with torch.no_grad():

            batch_size, sequence_len_by_input_size = np.shape(x)
            sequence_len = int(sequence_len_by_input_size / self.model.lstm.input_size)

            x = x.reshape(batch_size, sequence_len, self.model.lstm.input_size)

            x_tensor = torch.tensor(x, dtype=torch.float32)
            output = self.model(x_tensor)
            return output.detach().numpy()
Then you need to compute your SHAP value and visualise results:
import matplotlib.pyplot as plt
from sac_sm_lstm_actor import WrappedModel
import shap

wrapped_model = WrappedModel(actor)
batch_size, sequence_len, input_size = data.trained.size()
aggregated_data = data.trained.view(batch_size, -1).numpy()

# Use KernelExplainer for flexibility
explainer = shap.KernelExplainer(wrapped_model, shap.kmeans(aggregated_data, 10))  # Replace aggregated_data with flattened_data if needed

# Choose a subset of test data for efficiency (e.g., 100 samples)
subset_data = aggregated_data

# Compute SHAP values
shap_values = explainer.shap_values(subset_data)
np.round(shap_values, 4)


shap_values_logit_0 = shap_values[:, :, 0]  # Shape: (5, 120)
shap_values_logit_1 = shap_values[:, :, 1]  # Shape: (5, 120)

# Transform feature name
features = [f"cell_{i}_{f}" for i in range(sequence_len) for f in envs.features]
features = ["_".join(word[0] for word in item.split("_")) for item in features]

# Verify lengths match
assert subset_data.shape[1] == len(shap_values[0]), "Mismatch between features and SHAP values!"

# Plot SHAP values for a single sample
shap.force_plot(base_value=explainer.expected_value[0], shap_values=shap_values[0, :, 0], features=subset_data[0], feature_names=features, matplotlib=True, show=False, figsize=(20, 3), text_rotation=45)
plt.show()
plt.savefig("individual_explanation_positive.png")

shap.force_plot(base_value=explainer.expected_value[0], shap_values=shap_values[0, :, 1], features=subset_data[0], feature_names=features, matplotlib=True, show=False, figsize=(20, 3), text_rotation=45)
plt.show()
plt.savefig("individual_explanation_negative.png")

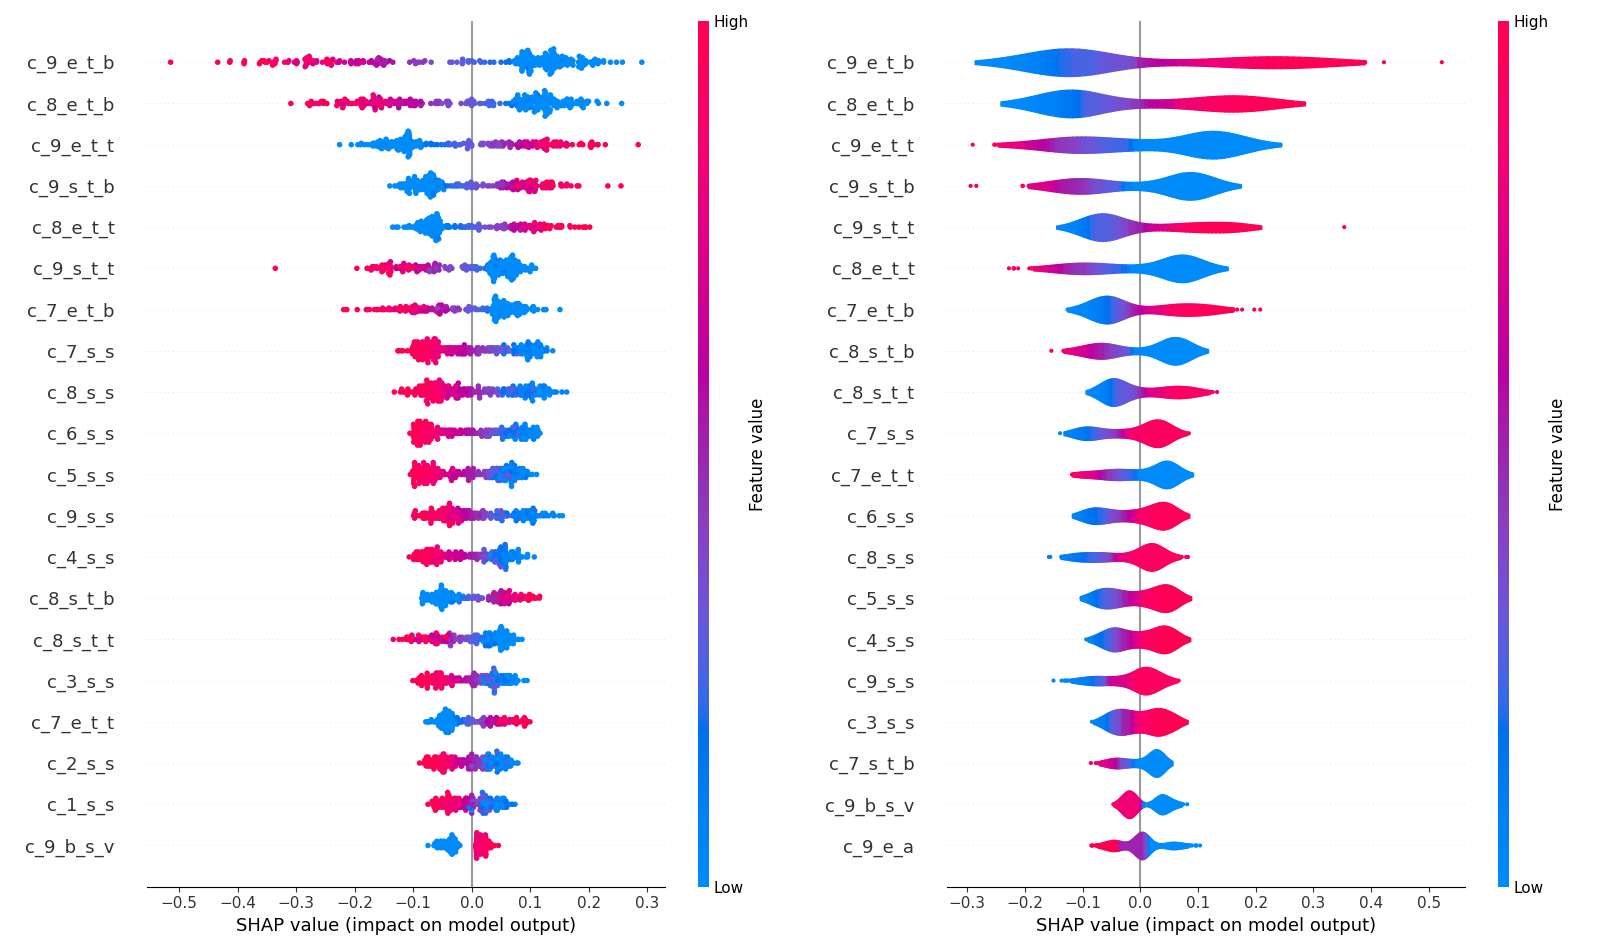
# Summary plot for the whole dataset "dot", "bar", "violin", "compact_dot"
shap.summary_plot(shap_values_logit_1, subset_data, feature_names=features, show=False, plot_type="dot")
plt.show()
plt.savefig("summary_positive_plot_dot.png")

shap.summary_plot(shap_values_logit_1, subset_data, feature_names=features, show=False, plot_type="bar")
plt.show()
plt.savefig("summary_positive_plot_bar.png")

shap.summary_plot(shap_values_logit_1, subset_data, feature_names=features, show=False, plot_type="violin")
plt.show()
plt.savefig("summary_positive_plot_violin.png")

shap.summary_plot(shap_values_logit_1, subset_data, feature_names=features, show=False, plot_type="compact_dot")
plt.show()
plt.savefig("summary_positive_plot_compact_dot.png")

shap.summary_plot(shap_values_logit_0, subset_data, feature_names=features, show=False, plot_type="dot")
plt.show()
plt.savefig("summary_negative_plot_dot.png")

shap.summary_plot(shap_values_logit_0, subset_data, feature_names=features, show=False, plot_type="bar")
plt.show()
plt.savefig("summary_negative_plot_bar.png")

shap.summary_plot(shap_values_logit_0, subset_data, feature_names=features, show=False, plot_type="violin")
plt.show()
plt.savefig("summary_negative_plot_violin.png")

shap.summary_plot(shap_values_logit_0, subset_data, feature_names=features, show=False, plot_type="compact_dot")
plt.show()
plt.savefig("summary_negative_plot_compact_dot.png")

